# Developer Console
The developer console is a tool that logs the information associated with a web page, such as JavaScript, network requests, and security errors. (It does other things, too, but this is all that really matters for this article.)
The information displayed in the developer console can be extremely helpful for the Portant support team when we're trying to figure out how to solve an issue. In the course of troubleshooting your issue, the Portant support team [may ask you to take a screenshot of the developer console](https://support.airtable.com/docs/how-to-take-a-screenshot).
The following are instructions for how to open the developer console on various different browsers.
### Chrome
To open the developer console window on Chrome, use the keyboard shortcut Ctrl + Shift + J (on Windows) or Cmd + Option + J (on Mac). Once in the Developer Tools, navigate to the Console tab.
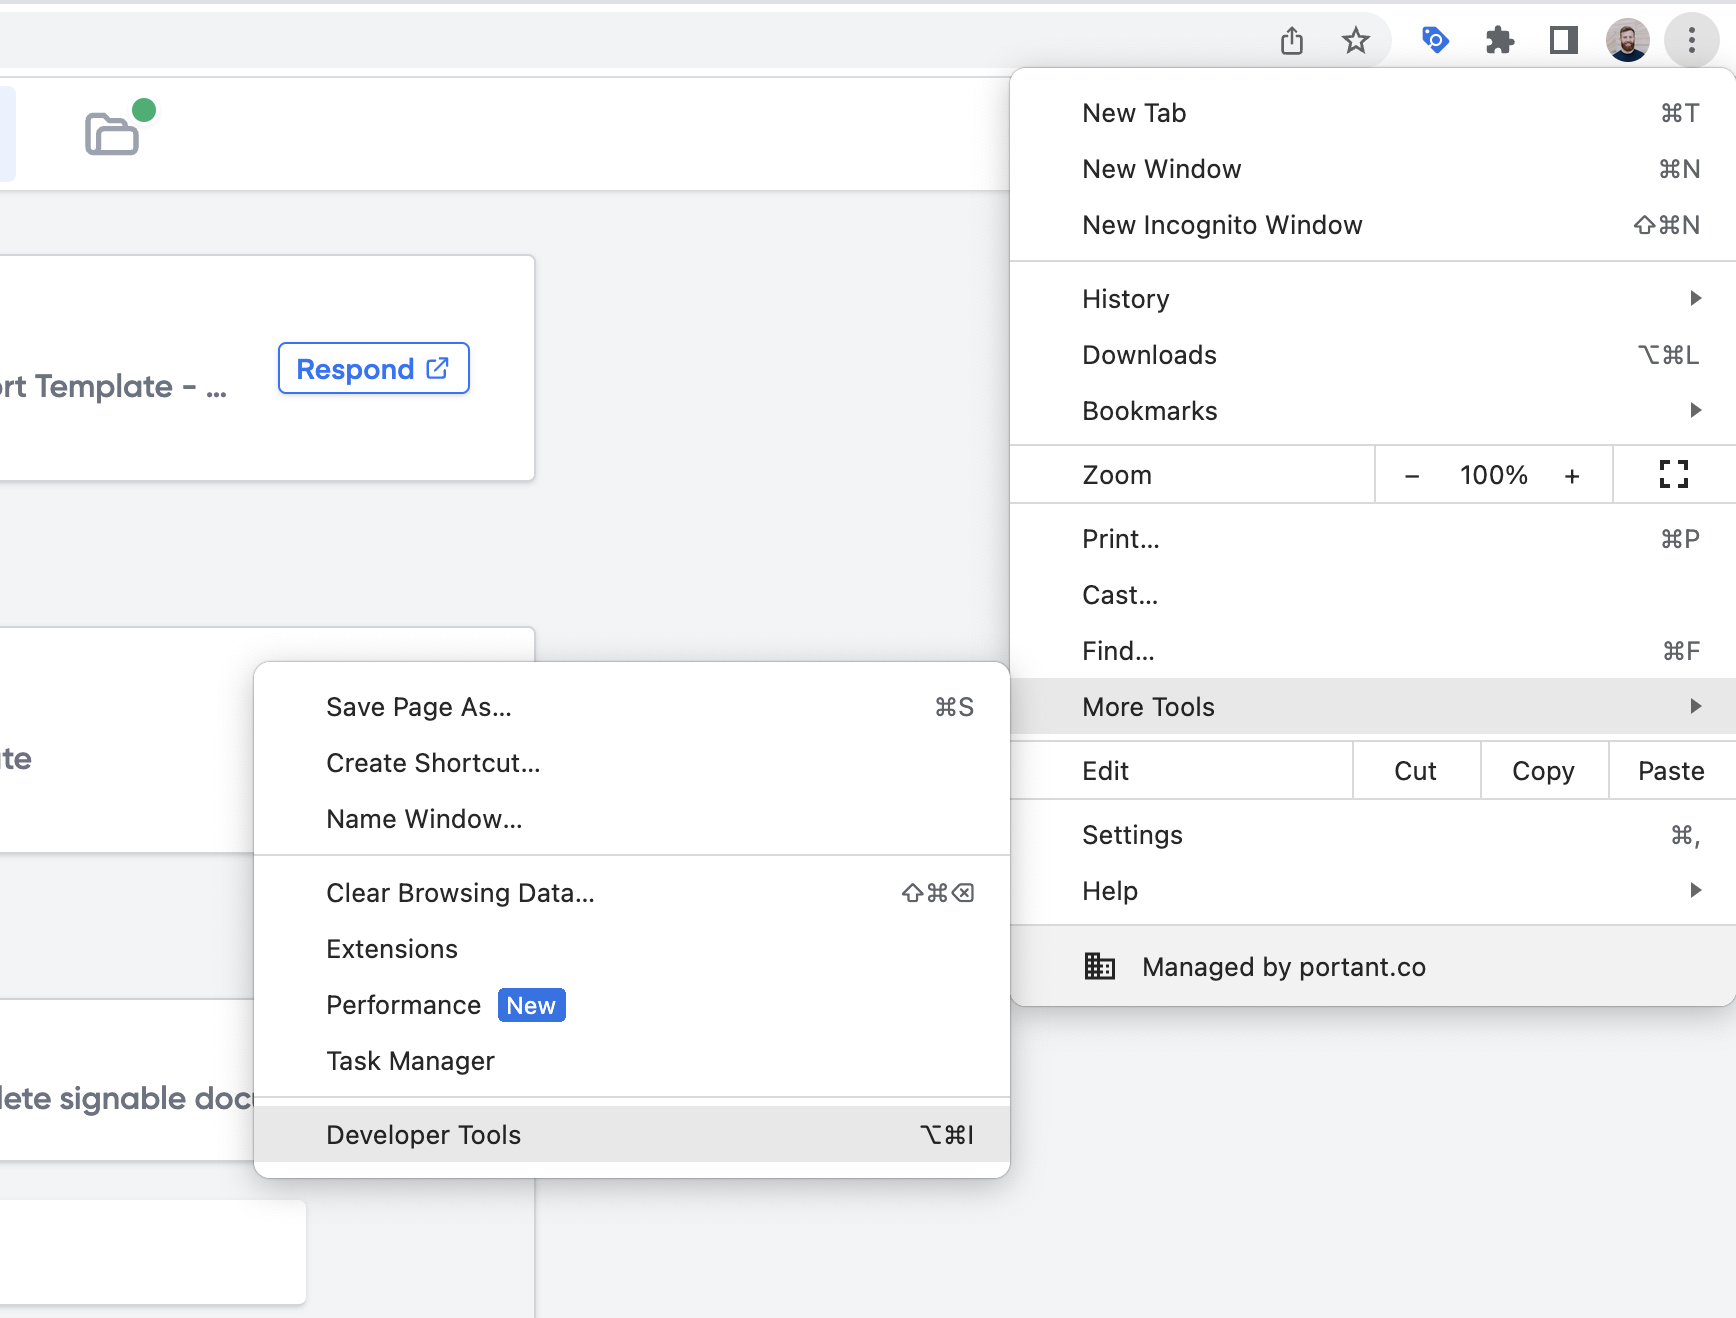
Alternatively, you can use the Chrome menu in the browser window, select the option "More Tools," and then select "Developer Tools." Once in the Developer Tools, navigate to the Console tab.
### Edge
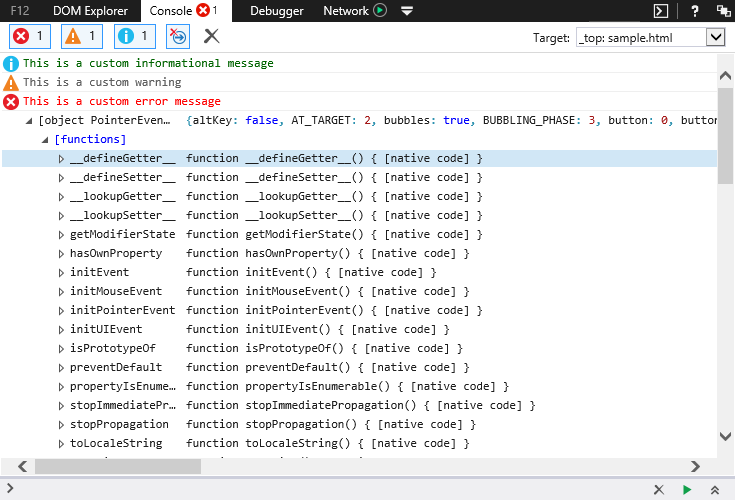
To open the console on Edge, hit F12 to access the F12 Developer Tools. Once in the F12 Developer Tools, navigate to the Console tab.
### Firefox
To open the console on Firefox, use the keyboard shortcut Ctrl + Shift + I (on Windows) or Command + Option + I (on Mac). The toolbox will appear at the bottom of the browser window with the Web Console activated.
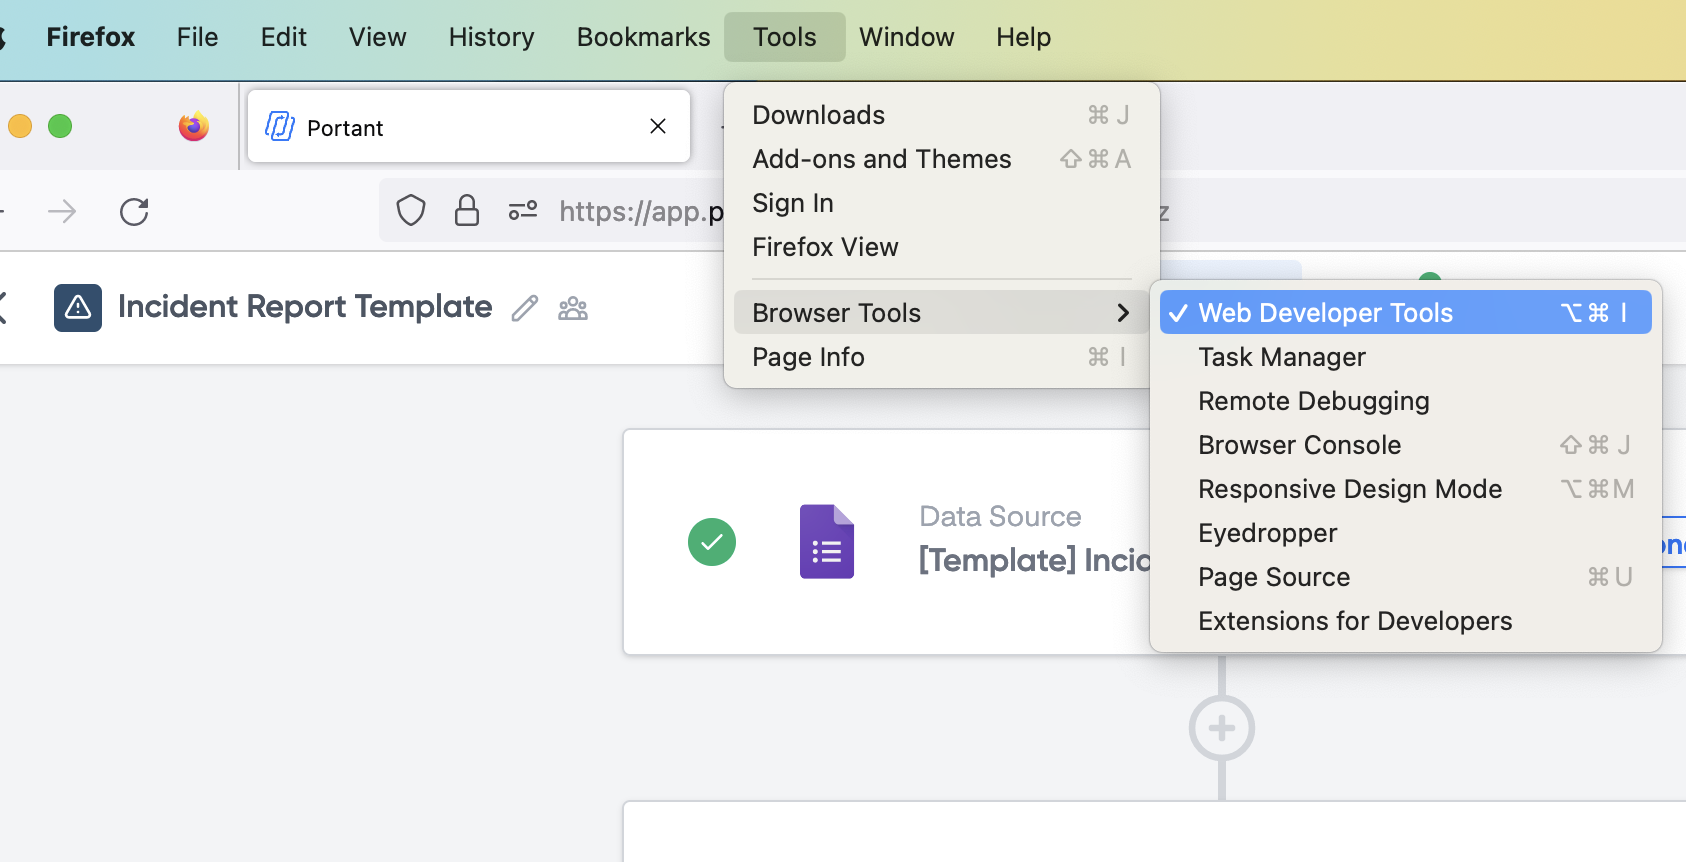
Alternatively, under the header Tools in the Mac menu bar, navigate to the sub-menu Browser Tools and select Web Developer Tools.
### Safari
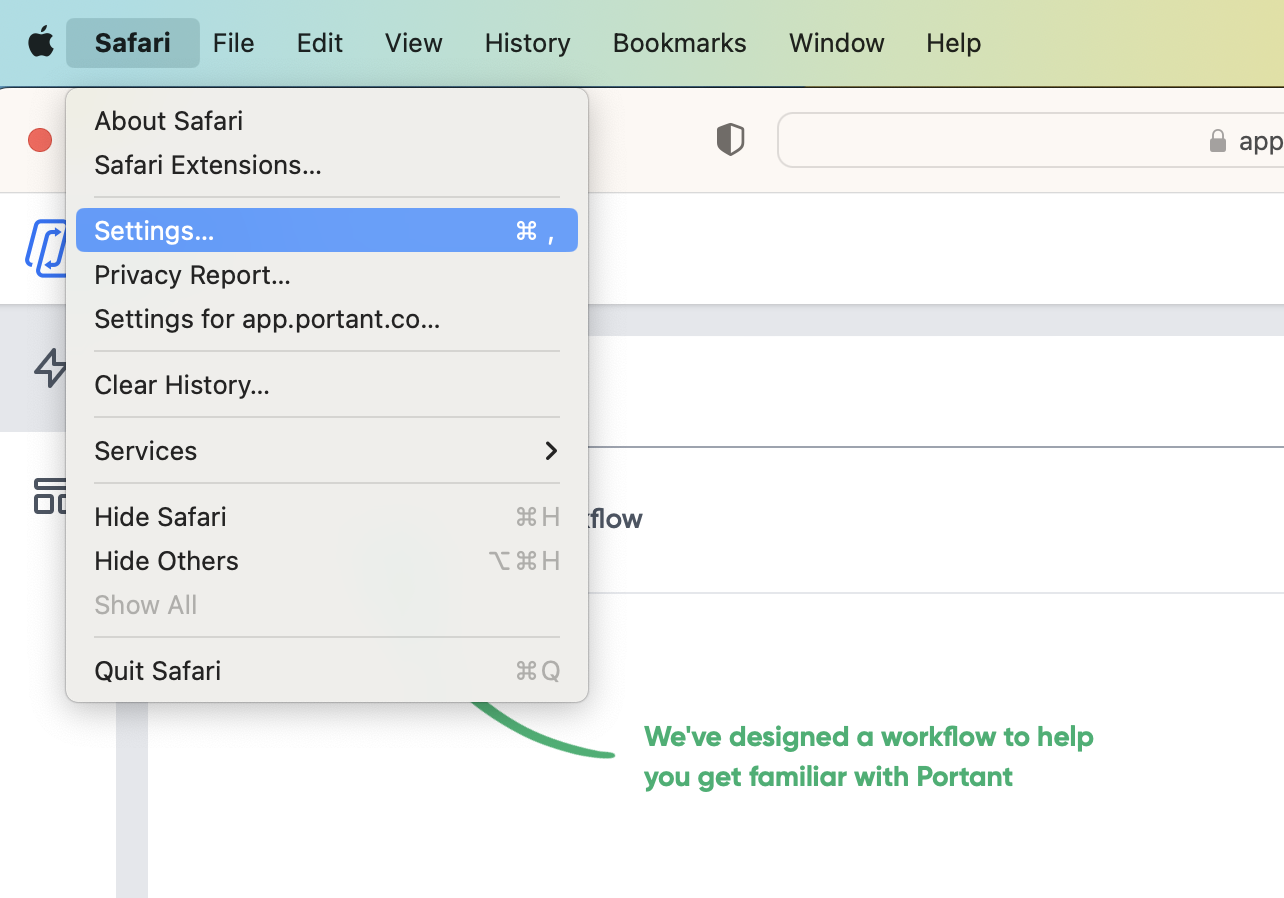
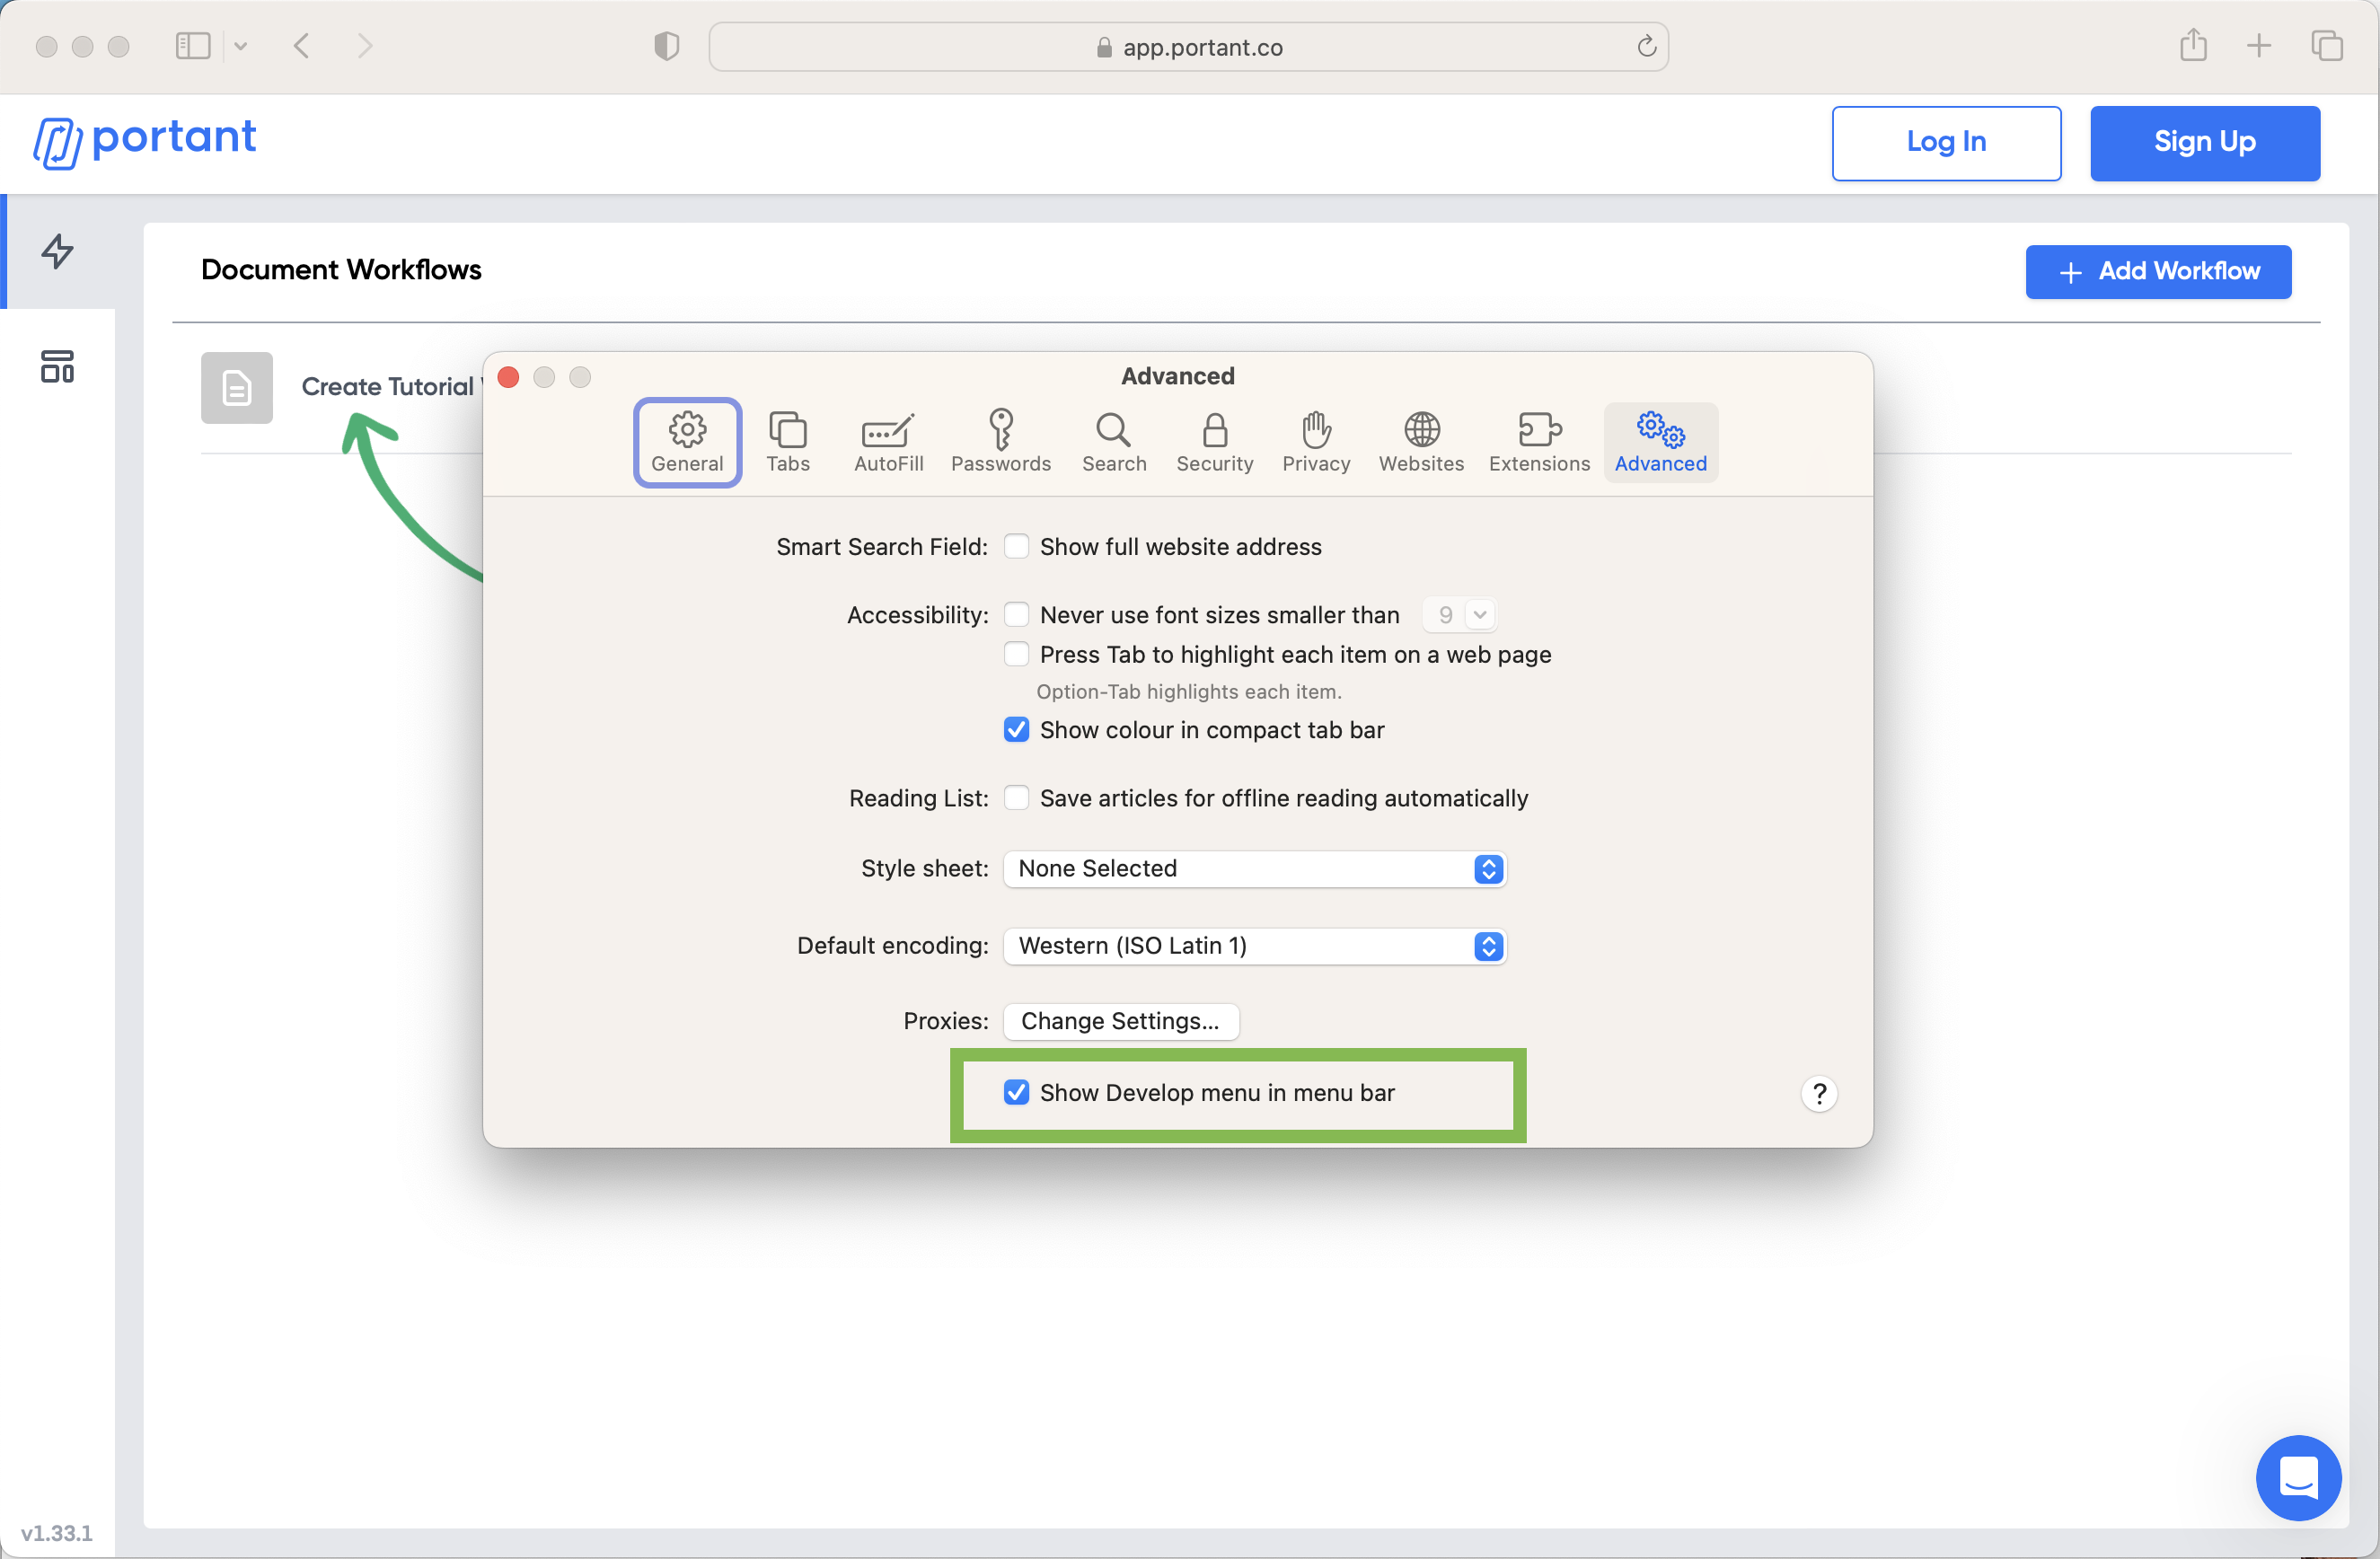
To open the console on Safari, you will first need to turn on the Develop menu. To do this, open the Safari menu in the Mac menu bar, then select Settings...
Once in the Settings dialog, navigate to the Advanced tab, then check the "Show Develop menu in the menu bar" box.
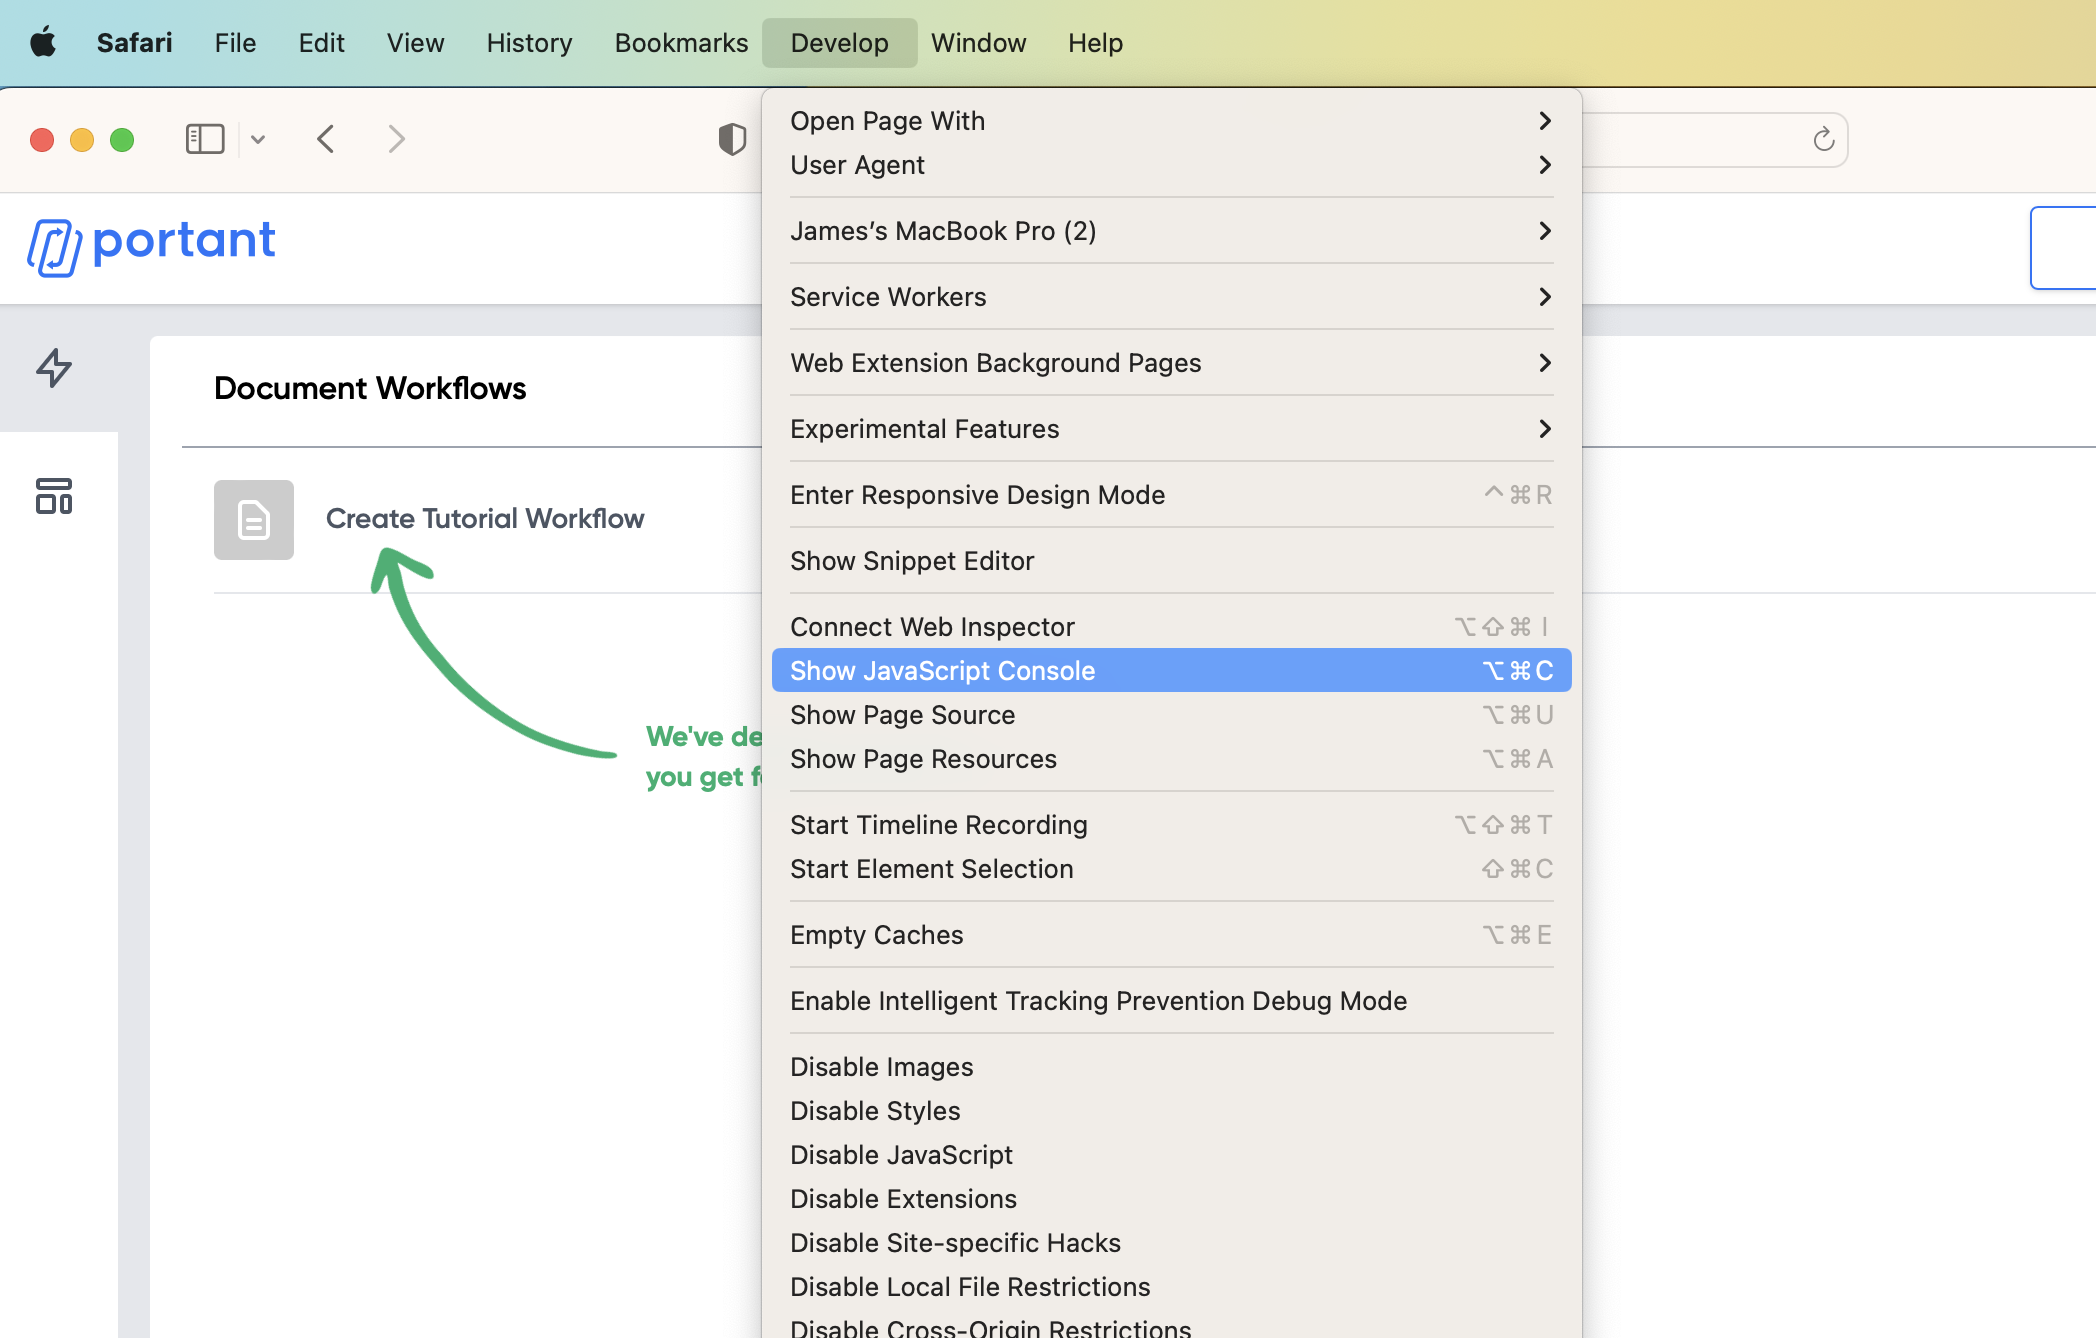
Once the Develop menu has been enabled, you can go to the Develop menu in the menu bar and then select the "Show JavaScript Console" option.
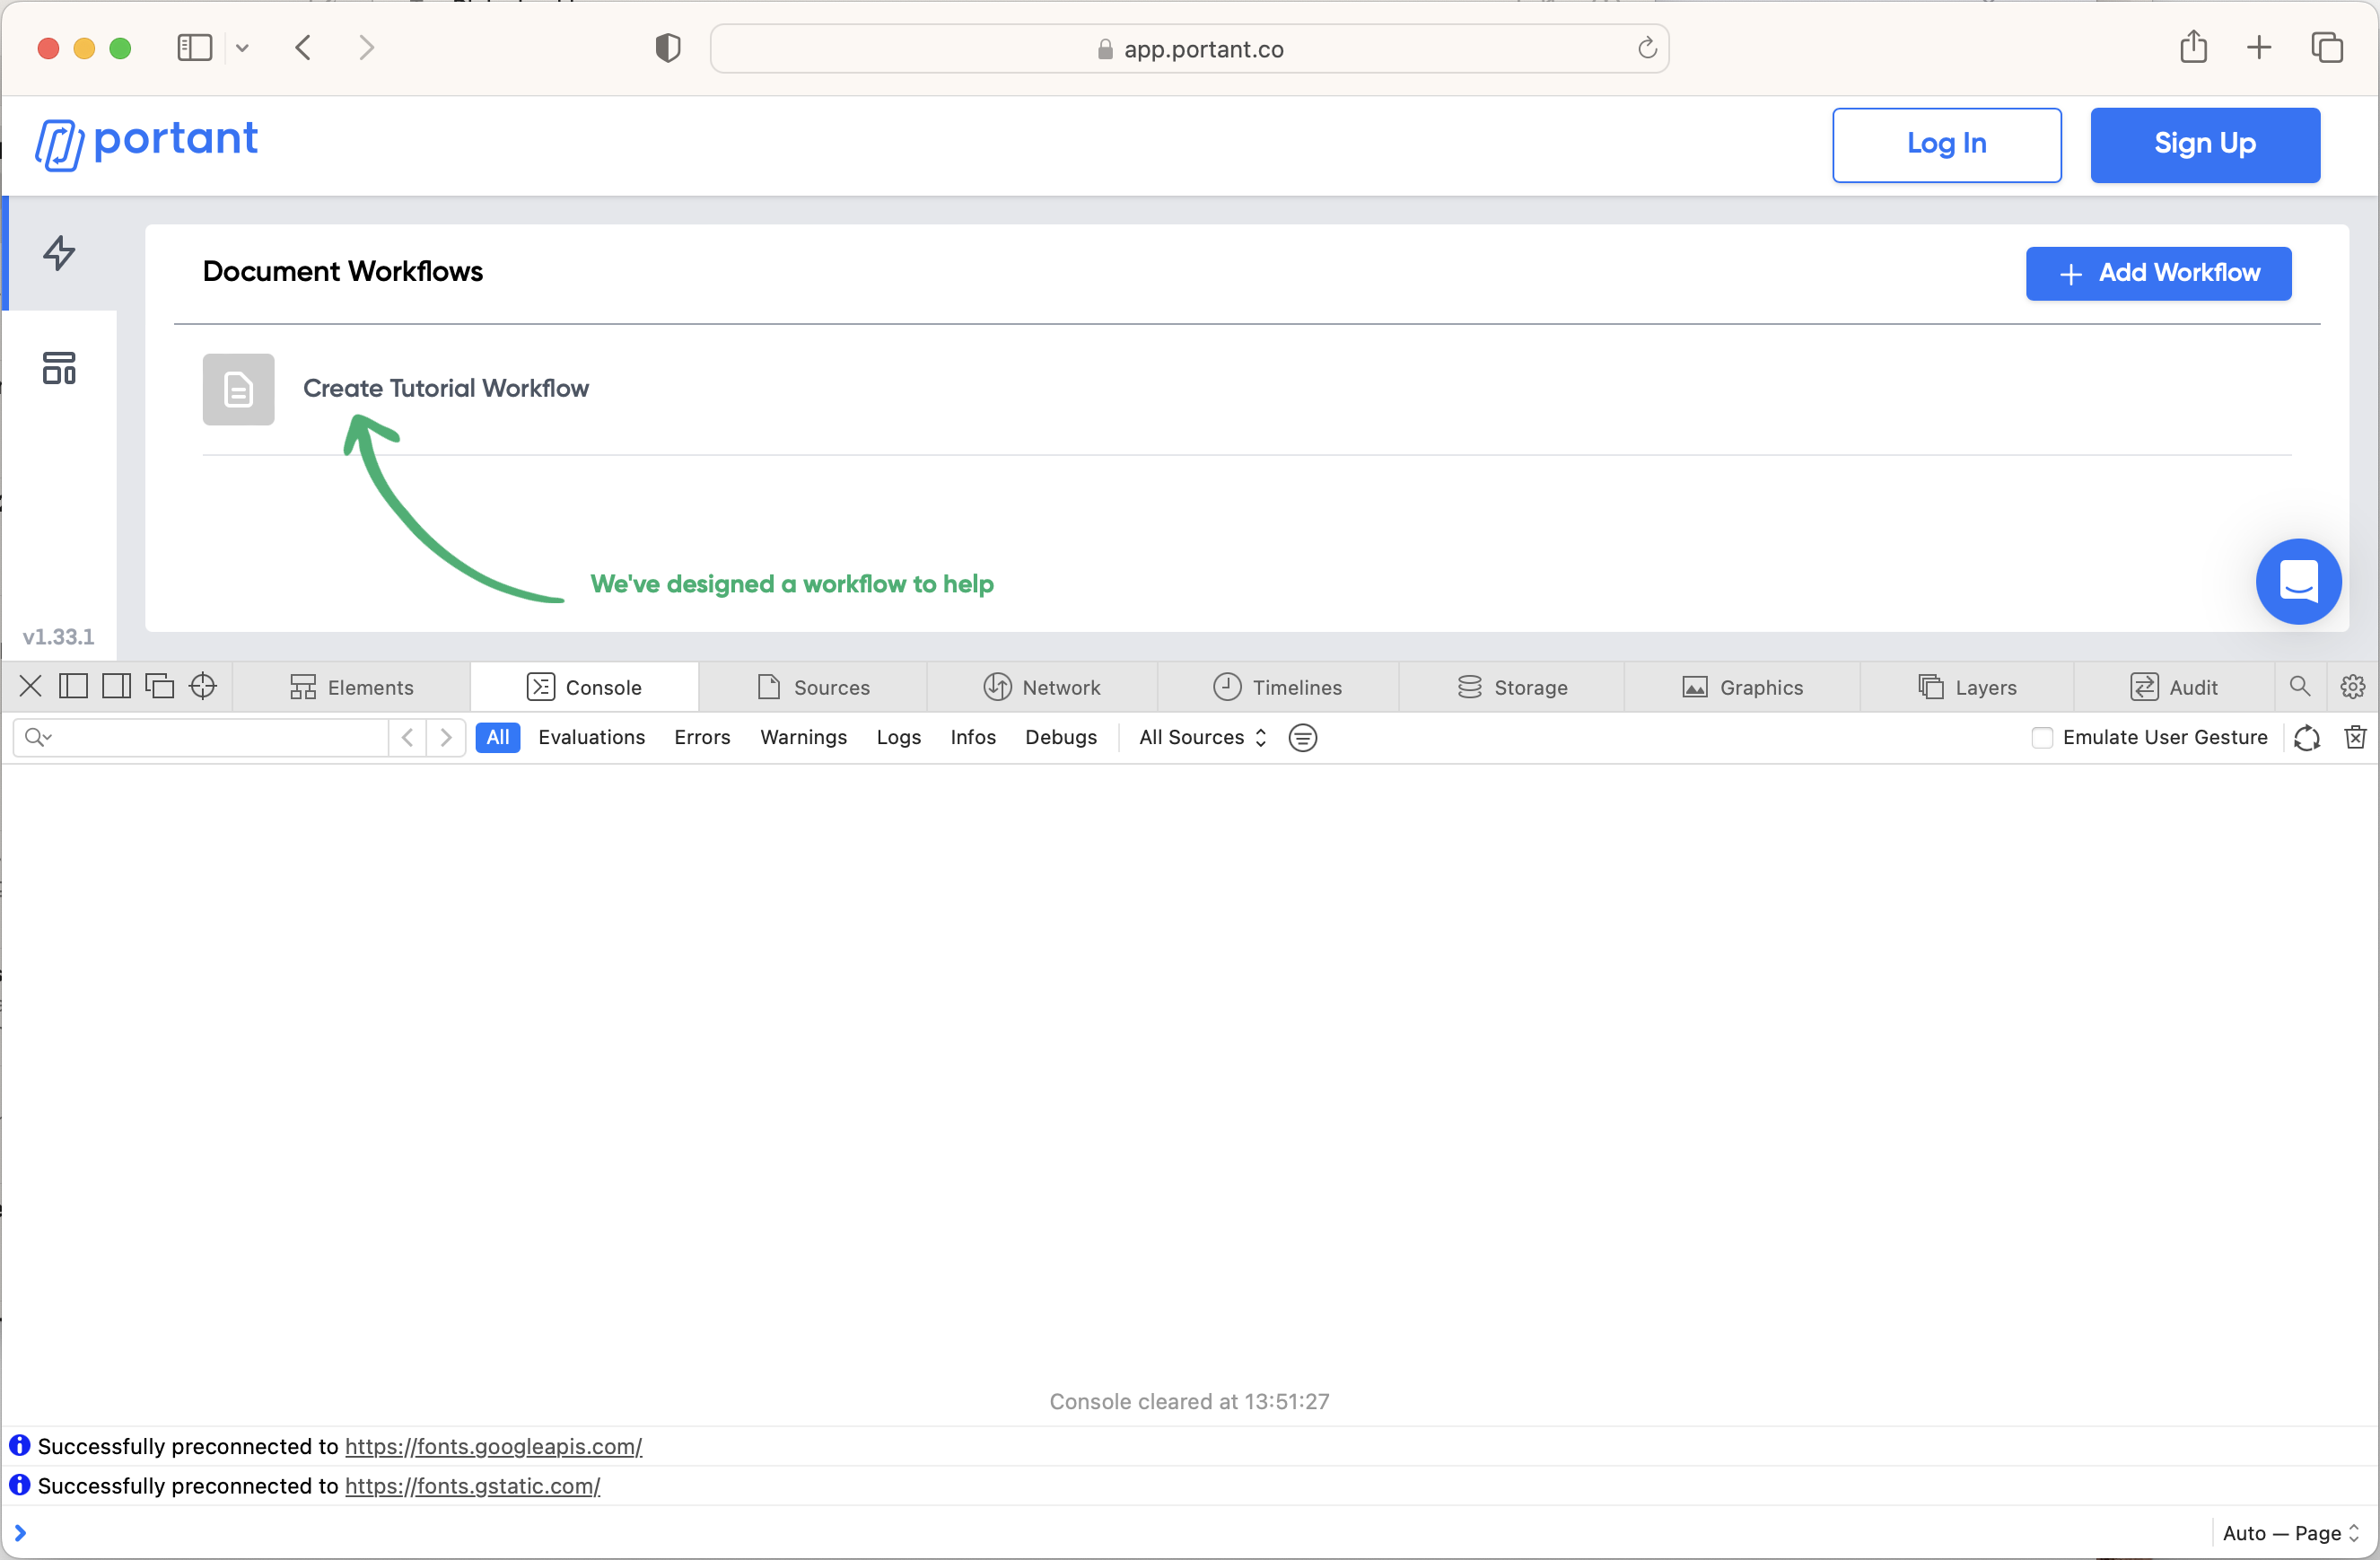
The JavaScript Console will show up on the bottom half of the active browser window.
Alternatively, you can use the keyboard shortcut Option + Command + C, though note that you will need to enable the Develop menu in your Safari Preferences for this shortcut to work.